Report Dissection
Most “critical thinking” drills stop at an essay. Real work rarely does. Report Dissection drops you into a believable brief: scenario line, KPI tiles, a short narrative, and a chart that actually has to be read, not admired. Your job is the same one you would have in a meeting: decide what the evidence allows you to say, and what would be overshooting.
Questions are tagged by move (for example interpretation): you pick the option that best matches the trend or relationship in the graphic, not the option that sounds most confident in English. It is deliberately a little dry, because that is where sloppy reading usually hides.
What it looks like
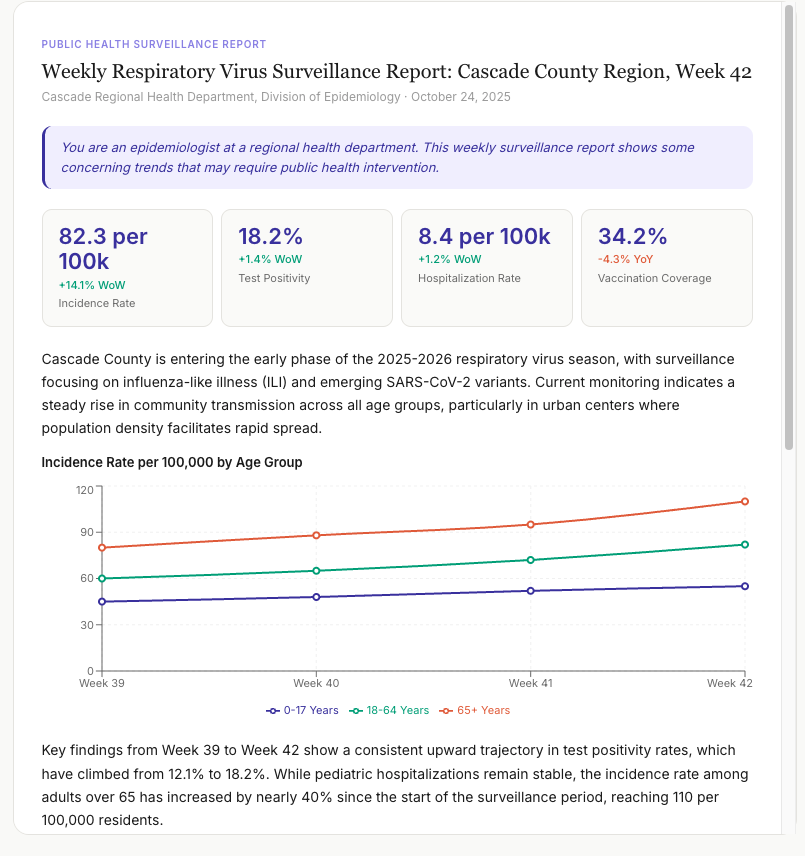
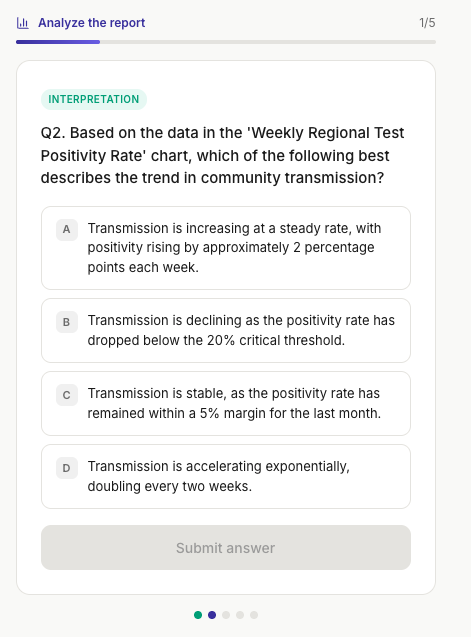
Below are real screens from the exercise: first the full surveillance-style report (metrics, context, and a multi-series chart), then a multiple-choice step that forces you to tie language to the plotted data.
What you practice
- Reading charts with attention to axes, units, series, and what changed over time
- Checking whether a stated trend matches the geometry of the data, not just the adjectives in the text
- Separating what the page proves from what a busy reader might wish were true
How it fits thessea
Morning Card and Live Reading lean on continuous prose. Report Dissection is the mixed-format layer: dashboards, memos, and slide logic where the risk is not missing a single sentence, but mis-syncing narrative and numbers. Same underlying habit: claims, evidence, and whether the reasoning holds, just with more pixels on the page.